
Ask yourself, what do you really want? What do your customers really want? What are the most important things about your product’s design, and what trade-offs will need to be made (given the real-world constraints we have to work under)?
These are the essential questions that a product design project will have to tackle. Often the answers are not clear, and quite often the questions are not even explicitly asked. Sometimes a manufacturer thinks they know what their customers will buy – and just ask the design team to create that product: sometimes in doing so the developers are constrained in ways that prevent them from delivering what would really have given the customers the most value and maximised the return on investment which is the product design and development process. Even if the manufacturer has a good understanding of what the customers really need or want then the design team need to have a list of specific technical requirements to achieve, and sometimes getting those requirements without losing sight of what really matters to the customer can be a challenge.
Quality Function Deployment (QFD) is a tool which can be used to help explore the fuzzy “wants” and “needs” of a customer and turn them into technical requirements – and then to turn those requirements into more detailed characteristics of parts, and optionally to define the processes & quality control requirements needed to make a successful product.
QFD is a product approach that is associated with the Japanese application of quality assurance principles to industry as their industrial base was rebuilt after the Second World War. It emerged in the 1960s from the work of Professors Mizuno Shigero and Akao Yoji, who wanted the burgeoning shipbuilding industry to ensure that customer satisfaction was designed into products from the start – in other words to make sure that the right things were being developed. It was then also used in the Japanese automobile industry, was adopted in turn by the US automobile industry and then became a key part of the Design for Six Sigma toolbox. Design for Six Sigma likewise sees that true quality begins with identifying the things which the customer needs from the product, and ensuring that the development project focuses on those things. (You can expect more detailed Design For Six Sigma (DFSS) – blog posts in future.)
The House Of Quality, or HoQ – so called because it does, in fact, look a wee bit like a house (with an extension and basement) – is the key tool of the Quality Function Deployment approach.
The diagram below is a simplified QFD House of Quality that shows the basics.
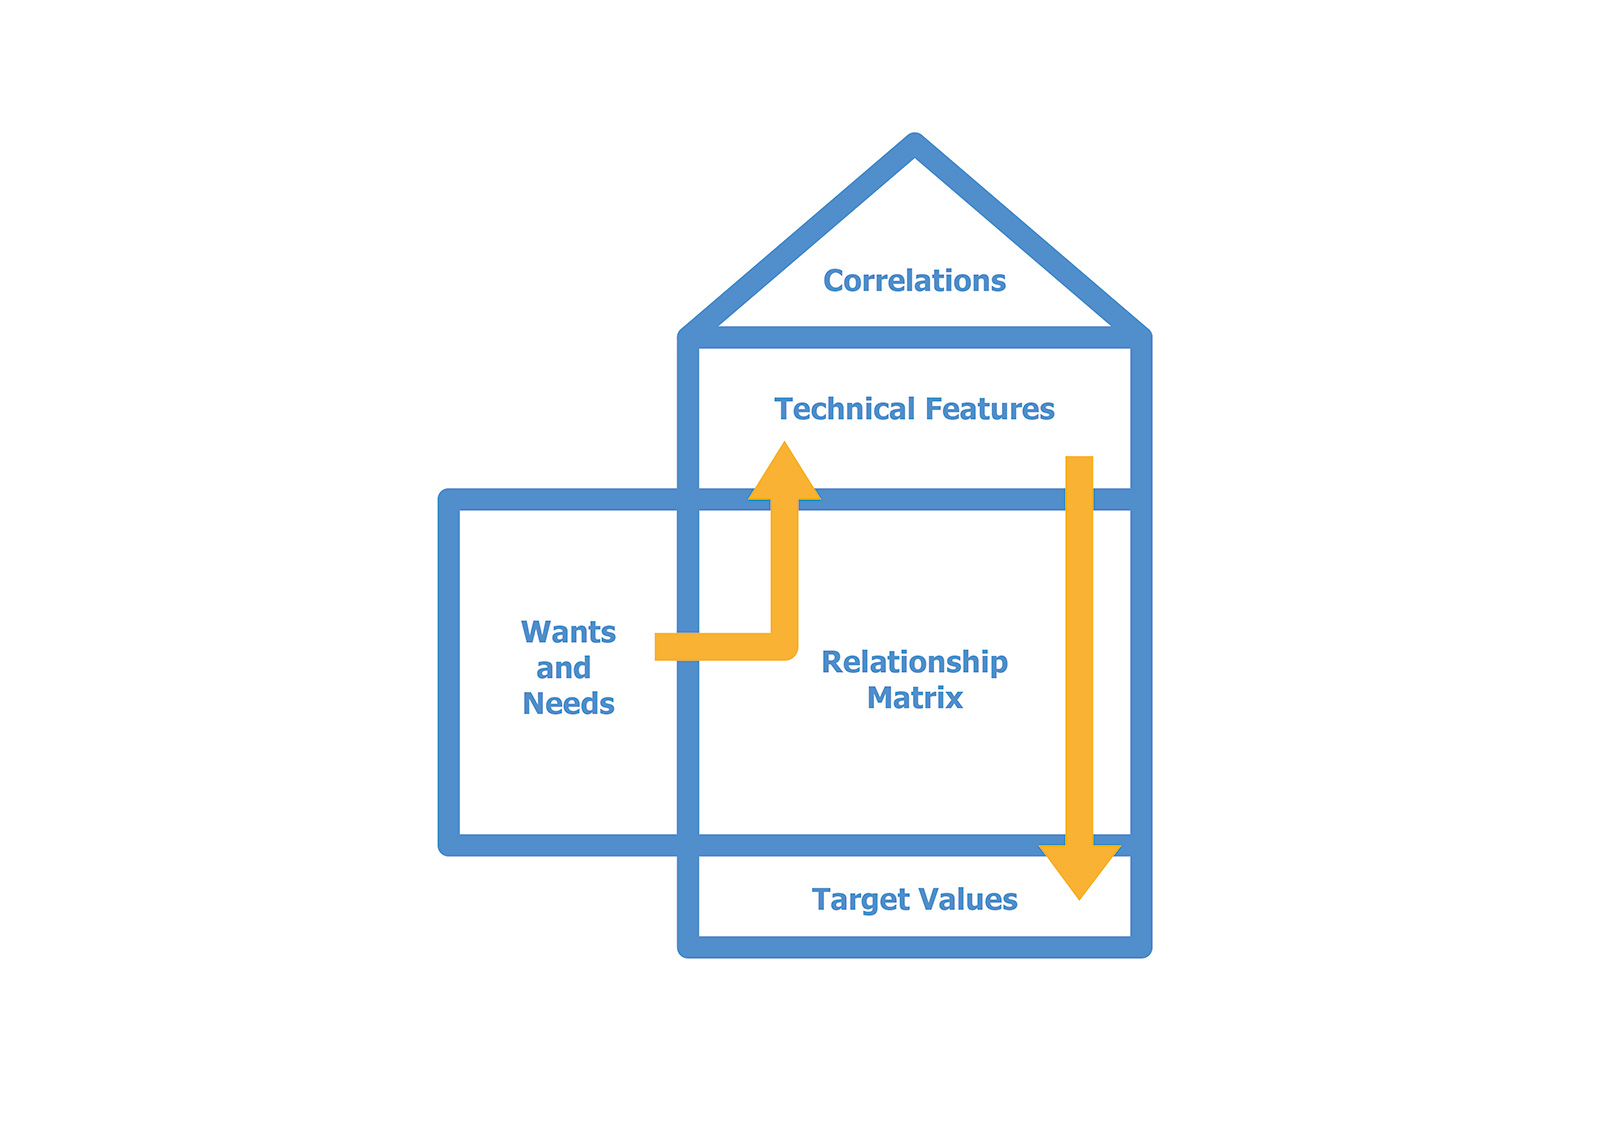
To the left, in the Extension so to speak, we have the customers’ wants and needs. These should be as non-technical and open as possible: we don’t want to specify, say, a screen brightness in nits (candela / m2) – instead we want to capture something like “Screen visible in brightly-lit environments”. Customers/users don’t actually care about brightness in nits, except for some technophiles perhaps – they want to be able to read the screen in the environment they actually use it: so say that is all you need to say you are talking about Customer Wants and Needs.
The upper storey of the House is where we define Technical Features. Here we can talk about screen brightness in nits to our heart’s content, and other such technical requirements. The Technical Features should be defined based on what those Wants and Needs are, not just pulled out of the air. The Relationship Matrix – the body of the house -- helps to record how those Technical Features are related to, and will satisfy, those Wants and Needs. This is a very important aspect of the House which we will talk about more shortly. In the basement we have Target Values for those Technical Features – so now we can say for instance that a value of at least 350 nits is wanted for the screen brightness.
Up in the roof of the House of Quality we have another of its key features – the Correlations matrix. This maps the Technical Features to each other, and is used to highlight the ones which help each other – a positive correlation – and those which oppose each other – a negative correlation. We will come back to that idea too in a little while.
There are more rooms to the HoQ than we’ve shown or discussed here: for instance those Wants and Needs should to be prioritised so that the designers know which ones are most important to the user (and so will give the most value when they are implemented). It also helps you think about whether the Technical Features identified need to be maximised (to achieve the highest value possible, for instance battery life), minimised (to achieve the lowest value possible, for instance the heat generated), or optimised (to achieve a specific value, for instance sized to fit into a particular space). There is also the option to benchmark this product against earlier versions or against competitors’ product, so that we can identify areas where the product performance needs to be improved: this can be very useful for a project to update or revise a product.
The Relationship Matrix sits at the heart of the HoQ. Here we map the customer Wants and Needs to specific Technical Features. At a minimum we just identify where a Want or Need is satisfied by a Feature, but to take things to the next level we can also identify whether this is a Strong correlation – in other words implementing this Feature will make a significant contribution to satisfying the Want – or a Medium or Weak correlation. Figure 2 below is the HoQ Simplified Relationship Matrix that shows a simplified example.
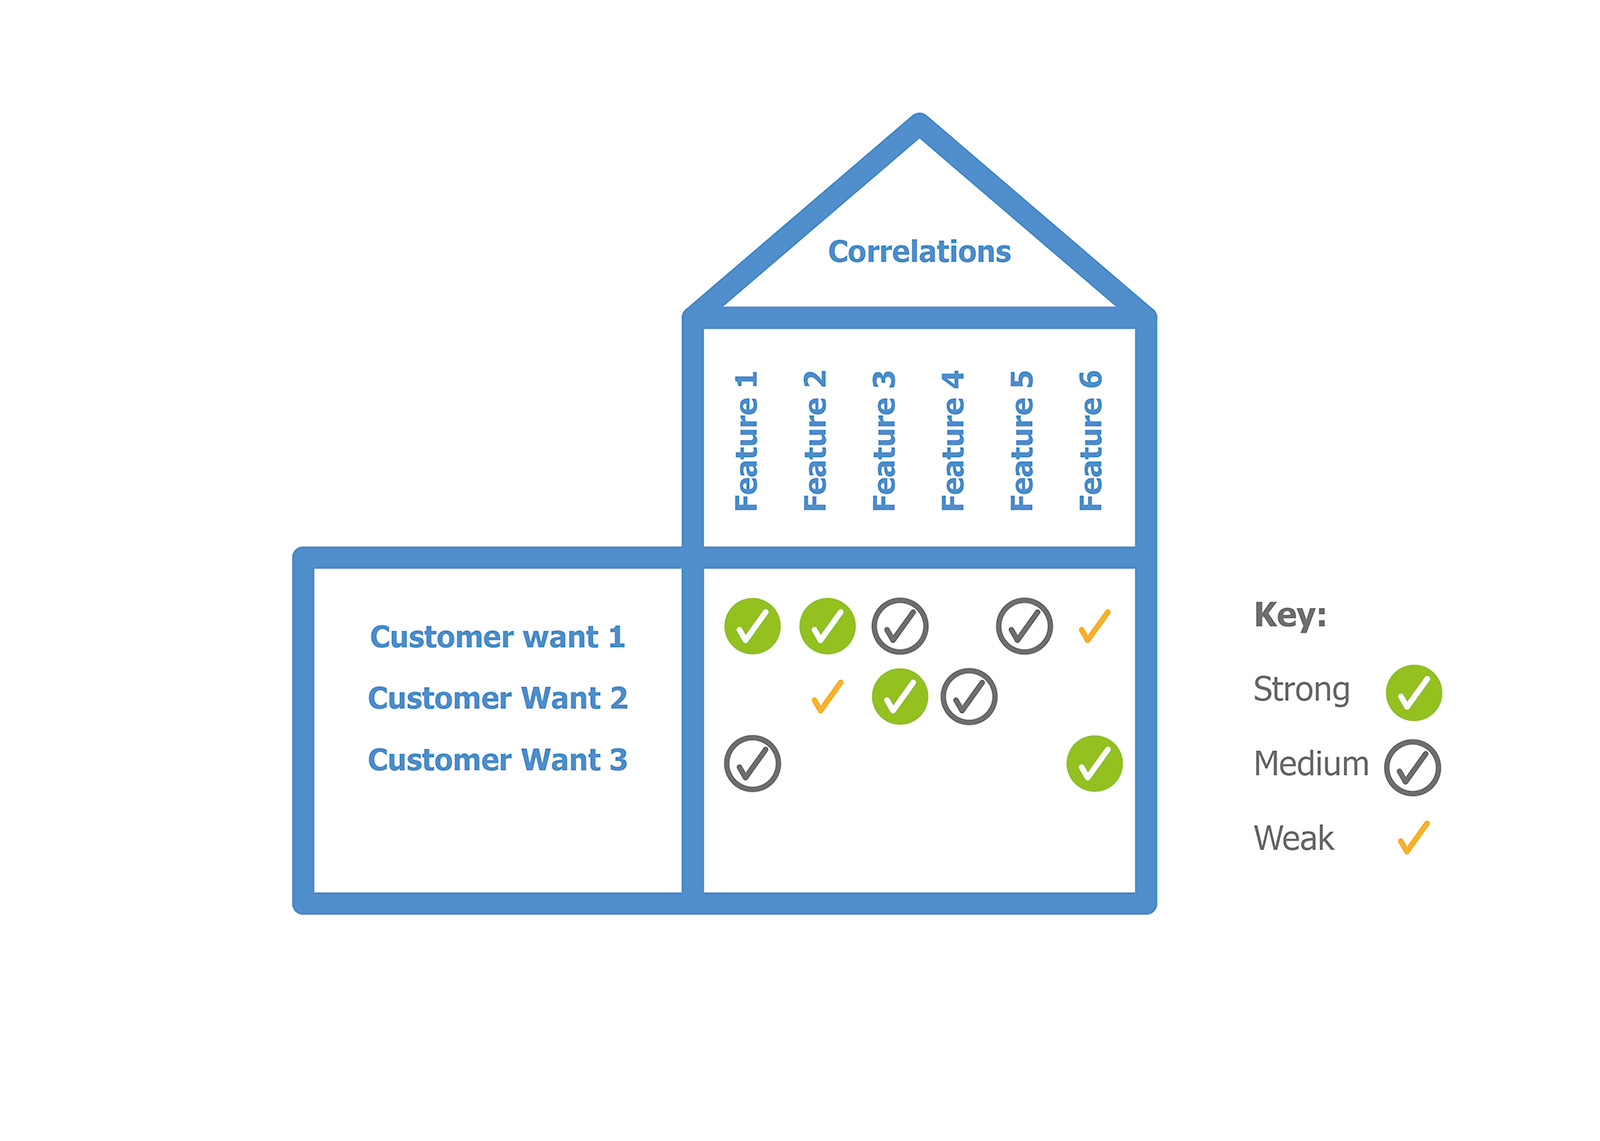
An individual Feature might be added to the HoQ because it satisfies one particular Want or Need, but it can then become apparent that it actually contributes – perhaps only weakly, but perhaps strongly – to our ability to satisfy one or more other Wants.
So for example we might have a customer Need to have the battery in a handheld product last for a typical work shift without recharging. A Technical Feature that would be related strongly to this is the Battery Capacity, and another one is the Power Consumption. But there are other characteristics that will interact with the battery life: for instance if we have to transmit a lot of data over Wifi then this will consume energy which reduces battery life, where using Bluetooth might use much less energy, so the wireless technology which we use has a correlation with battery life.
If we have the customer Wants and Needs ranked so that we know which are most important to the customer, then we can assign a weight to each Want and Need (higher value = more important). Now if we assign values to Strong, Medium and Weak correlations (typically we use 9, 3 and 1 so that the Strong correlations dominate) we can do a bit of arithmetic (in Excel) and assign an Importance value to each Technical Feature – you multiply the Want weighting by each Relationship value and then add up each column.
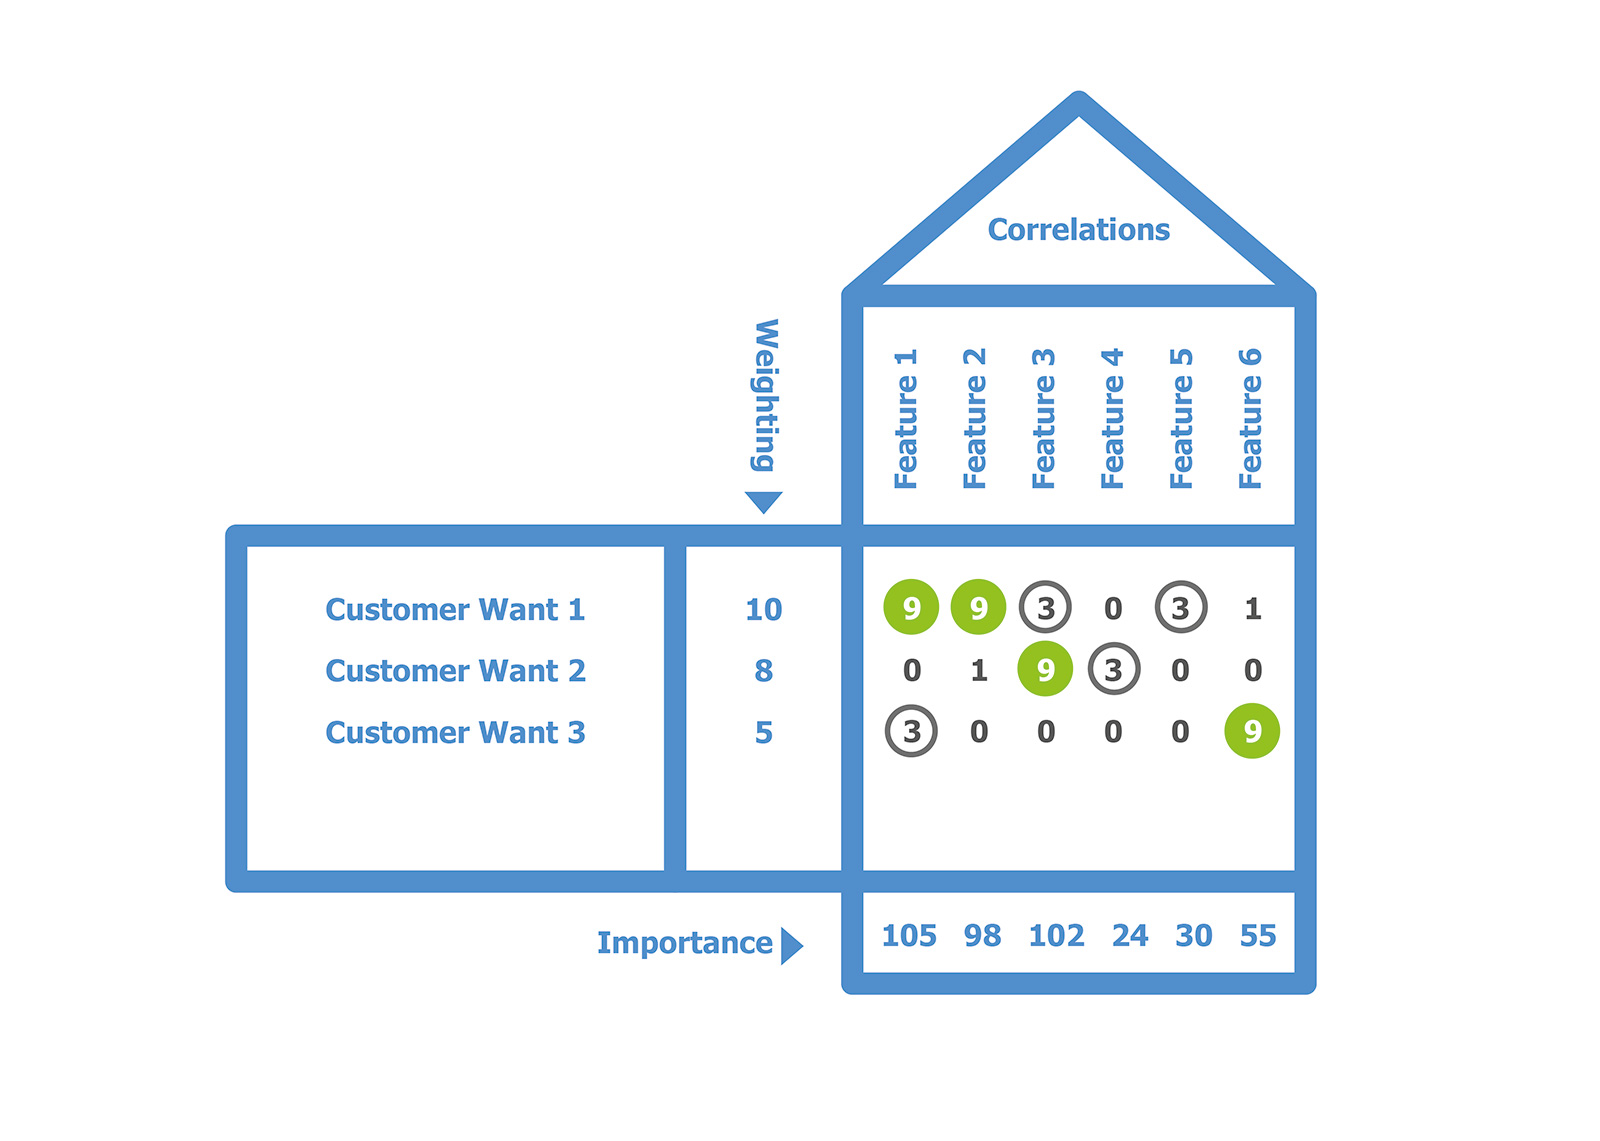
This now gives us a way to determine the relative importance of individual features, and that can give an insight into how to prioritise work. For instance in the simple example shown in Figure 3 - Simplified Feature Importance Example we can see that Features 1 and 3 have the highest importance rating. We should definitely get the team working on those, and do what we can to reduce any risks associated with them. Features 5 and 6 by comparison are relatively low importance: we can defer development on those for now, and if it turns out that we need to cut features to achieve delivery times or to meet the development budget then removing those features will have a lesser impact on customer satisfaction with the completed product.
It is also helpful to look at the minimum values in each row and column of the Relationship Matrix, and especially to look for any which don’t have any Strong relationship, or even any which don’t have any relationships identified at all.
If we find a row with no Strong relationships then that is a warning sign: here is a Want or Need which has been identified – but we have not defined any Features which will make a significant contribution to delivering it. That tells us our technical solution is likely to be incomplete – and unless we do something about it an unhappy customer is the likely outcome!
On the other hand a column with no Strong relationships is a warning that we are in danger of over-engineering the product or wasting development effort. We have identified Features, which we then plan to deliver – but they are not going to significantly increase customer satisfaction. This can easily happen because a development team make assumptions about what the customer wants. Sometimes this assumption is valid, and there really is a previously unidentified customer Want: but this is not always the case, and the development team should certain challenge any Features which do not appear to have a strong link to customer satisfaction. Changes in requirements can also cause this to happen: the HoQ is a way to check that when the Wants and Needs to be addressed have changed, or even just their relative priorities, we have carried this change through to the rest of the development plan.
Another part of the HoQ that we briefly mentioned earlier which brings some new insight is the Roof, where we find the Correlations.
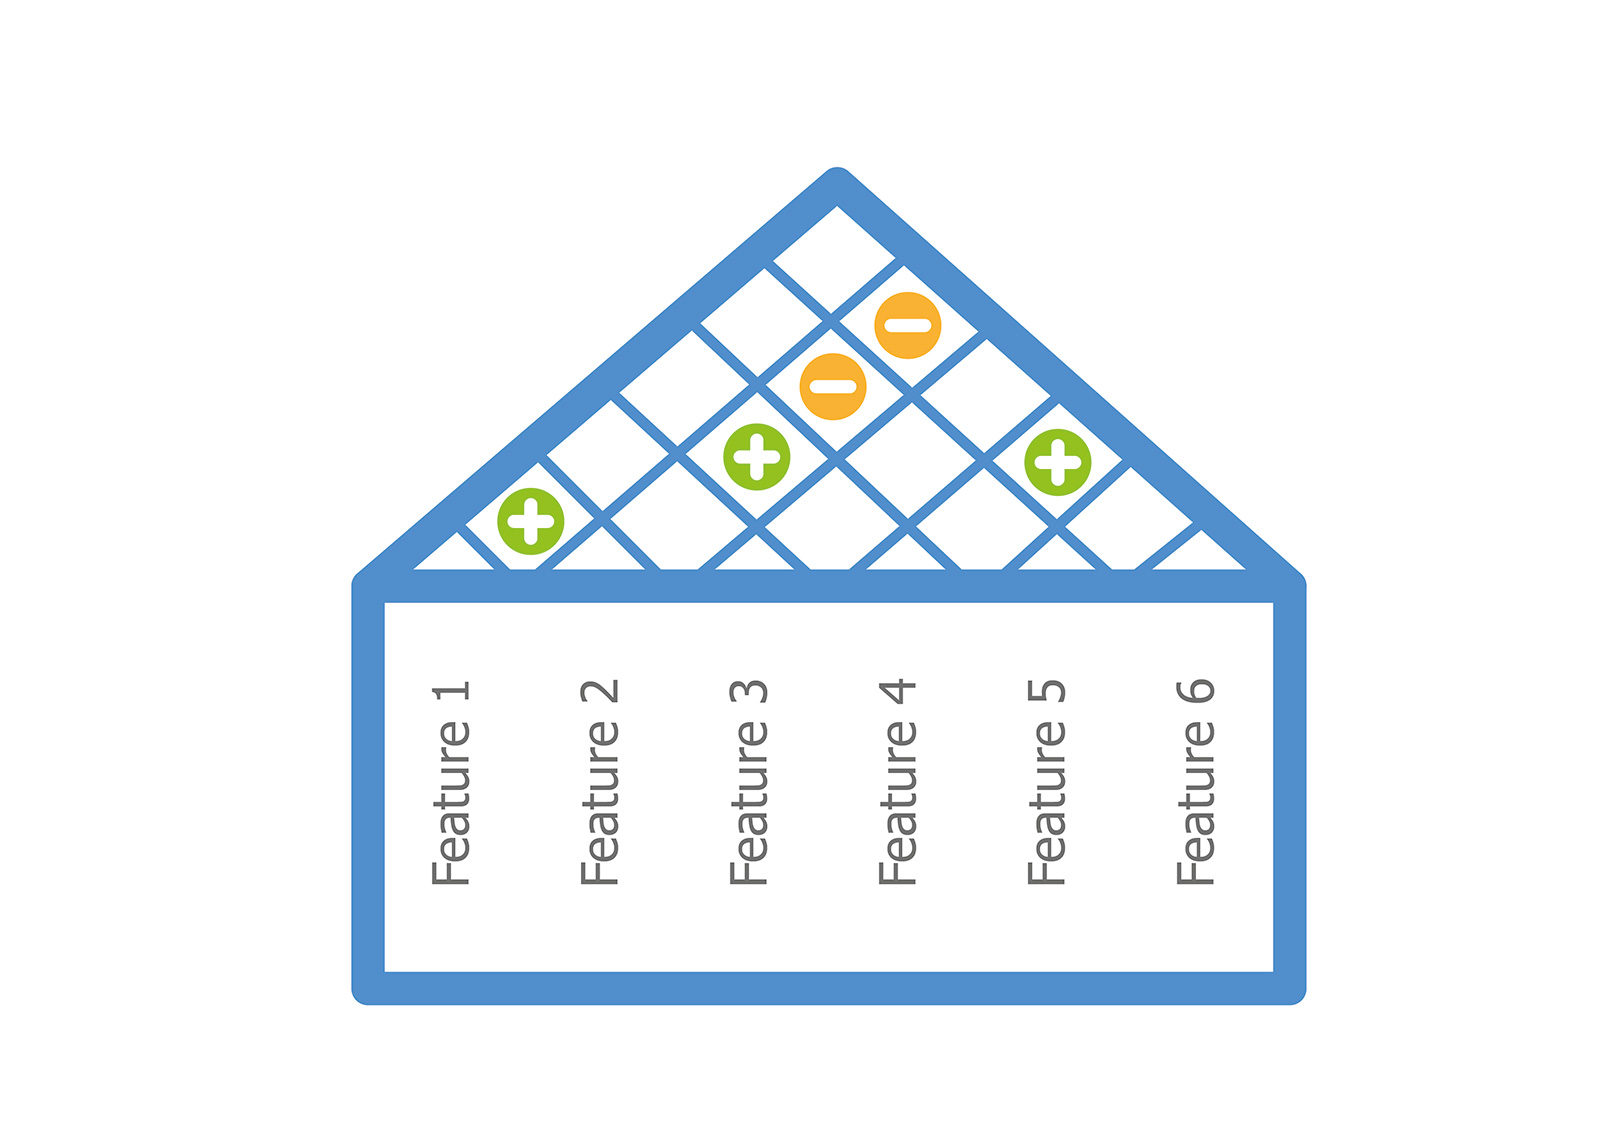
Here we look at each Feature in turn and how it impacts the other Features. Some features will have a positive impact on each other: for instance if we want a long battery life, then having more space to contain a larger battery can help – that is a positive correlation. On the other hand, a larger display will typically take more power – so that a larger display has a negative correlation with long battery life (although it has a positive correlation with unit size). Of course features can also be independent of each other, which simplifies planning, but means you will miss out on the synergistic benefits which a positive correlation indicates.
The example shown in Figure 4 (above) shows a positive correlation between Feature 1 and Feature 2. Implementing one of these will tend to make the other one simpler. Feature 2 also shows a positive correlation with Feature 4.
To complicate the picture however there are also some negative correlations: implementing Feature 2 will tend to make both Feature 5 and Feature 6 harder to achieve.
Generally speaking we do not need to look for hard-and-fast rules regarding the Correlations table – instead it is a place to look for increased risks or hard-to-resolve parameter decisions (where we have negative correlations), and for the synergies which may help make some parts of the design easier to realise.#
One HoQ can give us benefits, in terms of helping to convert those Wants and Needs into Technical Features which a development team can then tackle, and in terms of monitoring the what value the customer will get from those features. But we can go further, and use multiple Houses of Quality to further refine those Technical Features. Typically QFD training in the West shows the use of four HoQs – but designs based on 16 HoQs are not unknown, and the Comprehensive QFD system developed in Japan identifies over 30 HoQs which can be used! Don’t worry though, it’s not mandatory to use any more than are helpful.
The way a design flows down through the Houses of Quality is that at each iteration the “upper storey” items (in our example above, the Technical Features) then become the “extension” items (in our example above, the Customer Wants and Needs) for the next House. At each stage we need to identify what information is coming in, and what the next stage of refinement is that we wish to achieve.
The four HoQs identified in many QFD and DfSS training courses are often shown like this:
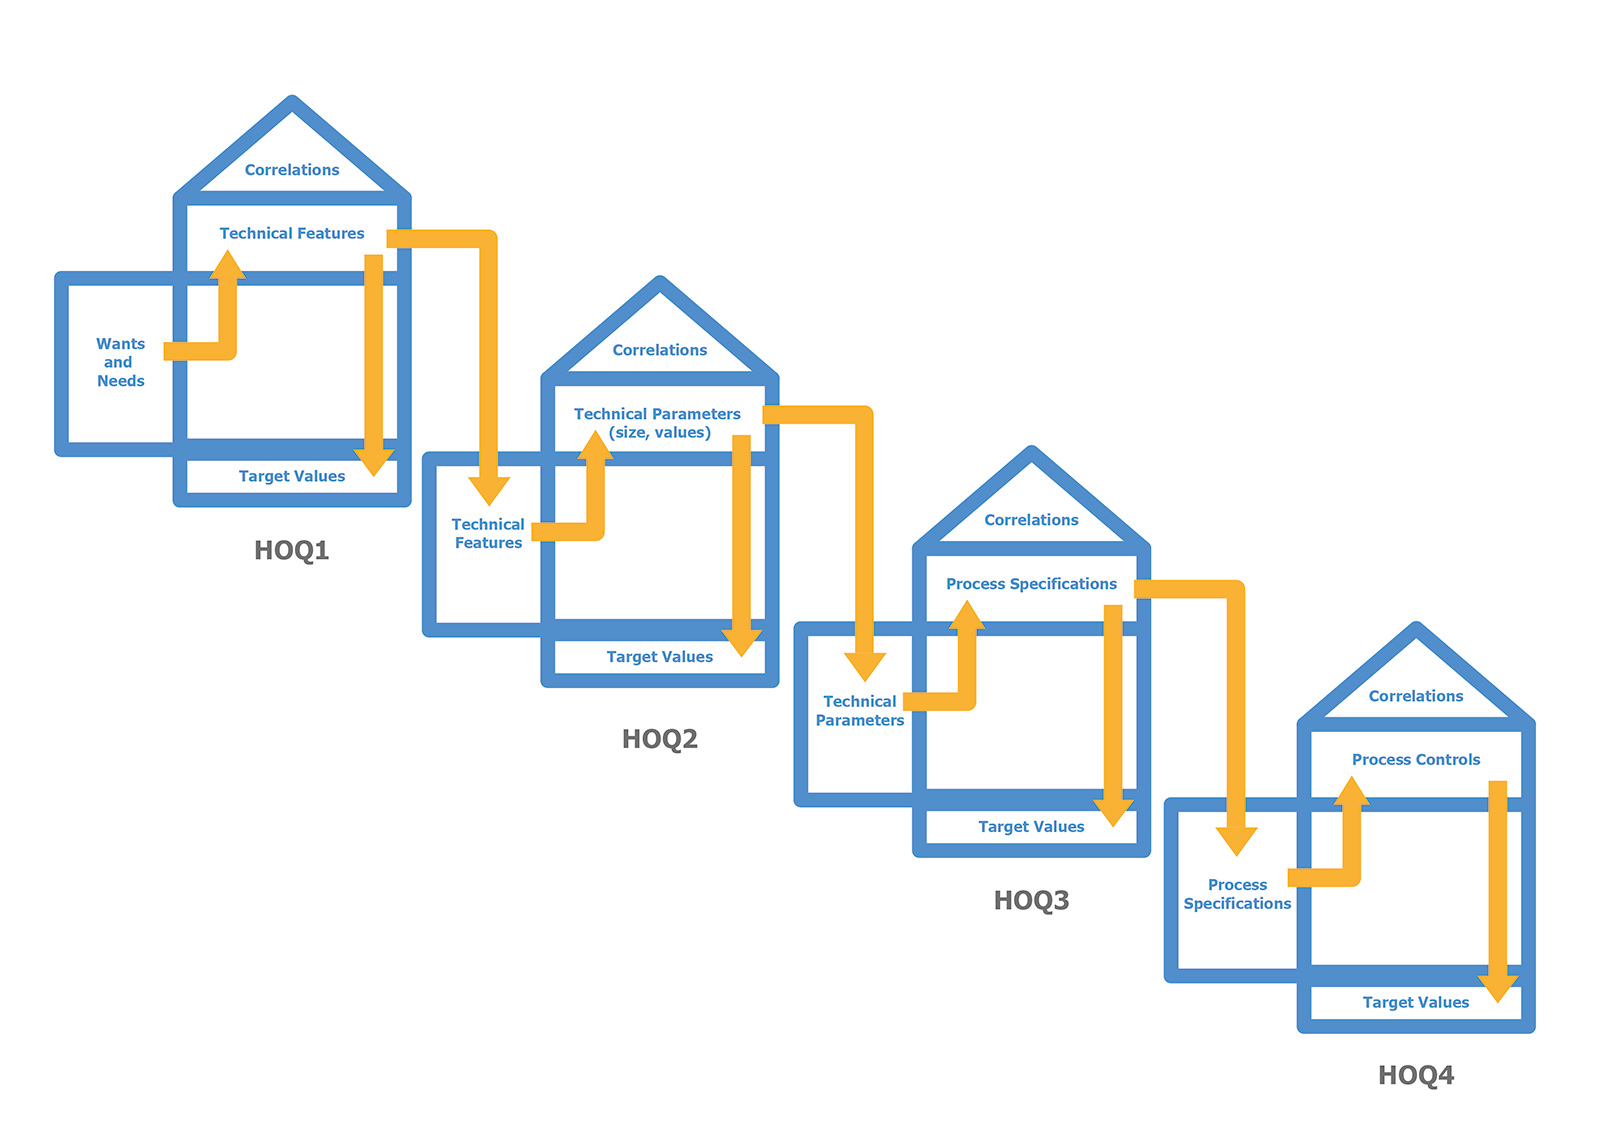
In this model the Houses of Quality successively guide the product development from initial customer-focused Wants and Needs – perhaps gathered by a Product Line Manager, Business Development Manager, or a Project Manager through direct contact with end-users and paying customers – through the product development process where Technical Features and their critical Parameters are identified and developed, and then on into the Operations / Production process where the goal is to set up the product for success by having in place a Process which guarantees product quality. Along the way we think about the questions “What is the right thing to develop?” and “Are we developing it right?” and end up with “How do we make sure we keep on making it right?”
In practice there are many other ways of using the Houses Of Quality, and often it is not necessary to use as many as four. In the author’s experience, 2 Houses Of Quality produces good results, focusing on converting Wants and Needs into Technical Features and then defining Technical Parameters for each of those features. The output from this can then be used to derive Verification Tests to ensure the outcome of the development project meets expectations. But where there are new or complex processes to create the finished products the further HoQ steps can continue to give good value and ensure that the process is capable and that the development team know how to monitor its continued capability in the long term.
We hope this introduction to QFD and the House Of Quality has shed light on the process and the value it can bring to product design and development. However, the best way to properly learn about the implementation of QFD is to apply it to a live project!
As a Product Design Consultancy, i4PD are experienced at working with both established clients who already use this process and start-ups who simply have a concept for solving a customer problem. For both types of clients we have helped capture the customer Wants and Needs, and/or support the refinement of those Wants or Needs into prioritised Technical Features, helping them get to market with a product that can maximise customer satisfaction.
Now armed with an understanding of a tool to help distill what technical features you plan to implement into your new product, it might be worth reading about how to phase these features into the product through it's development and after its commercial release. You can learn about this in our previous Design Insight article on Agile Development.
QFD Institute – What is QFD? http://www.qfdi.org/what_is_qfd/what_is_qfd.html
Introduction to Design for Six Sigma (DFSS) https://quality-one.com/dfss/
Copyright © 2024 i4 Product Design Ltd. All rights reserved. | Privacy Policy